
Huntington Beach Ranks First Among 62 Similar-Size California Cities for Bicyclists Killed or Injured
Huntington Beach ranked first among 62 California cities of similar size for bicyclists killed or injured in 2023, according to crash rankings published by the California Office of Traffic Safety (OTS). The city recorded 198 bicyclists killed or injured that year. It has ranked first or second in its group in every year from 2017 through 2023.
Younglove Law Group reviewed seven years of OTS rankings for Huntington Beach to see where the city stands. For information about how the firm handles these cases, visit our Huntington Beach bicycle accident lawyer page. The scorecard and tables below are free to cite or republish with a link back to this page.
Where Huntington Beach Stands Out
Huntington Beach is known for riding. The city has miles of beach path, a busy downtown and Pacific Coast Highway running along its shoreline, and bicycles are part of daily life for residents and visitors alike. The state rankings show how often those rides end in a crash that kills or injures someone.
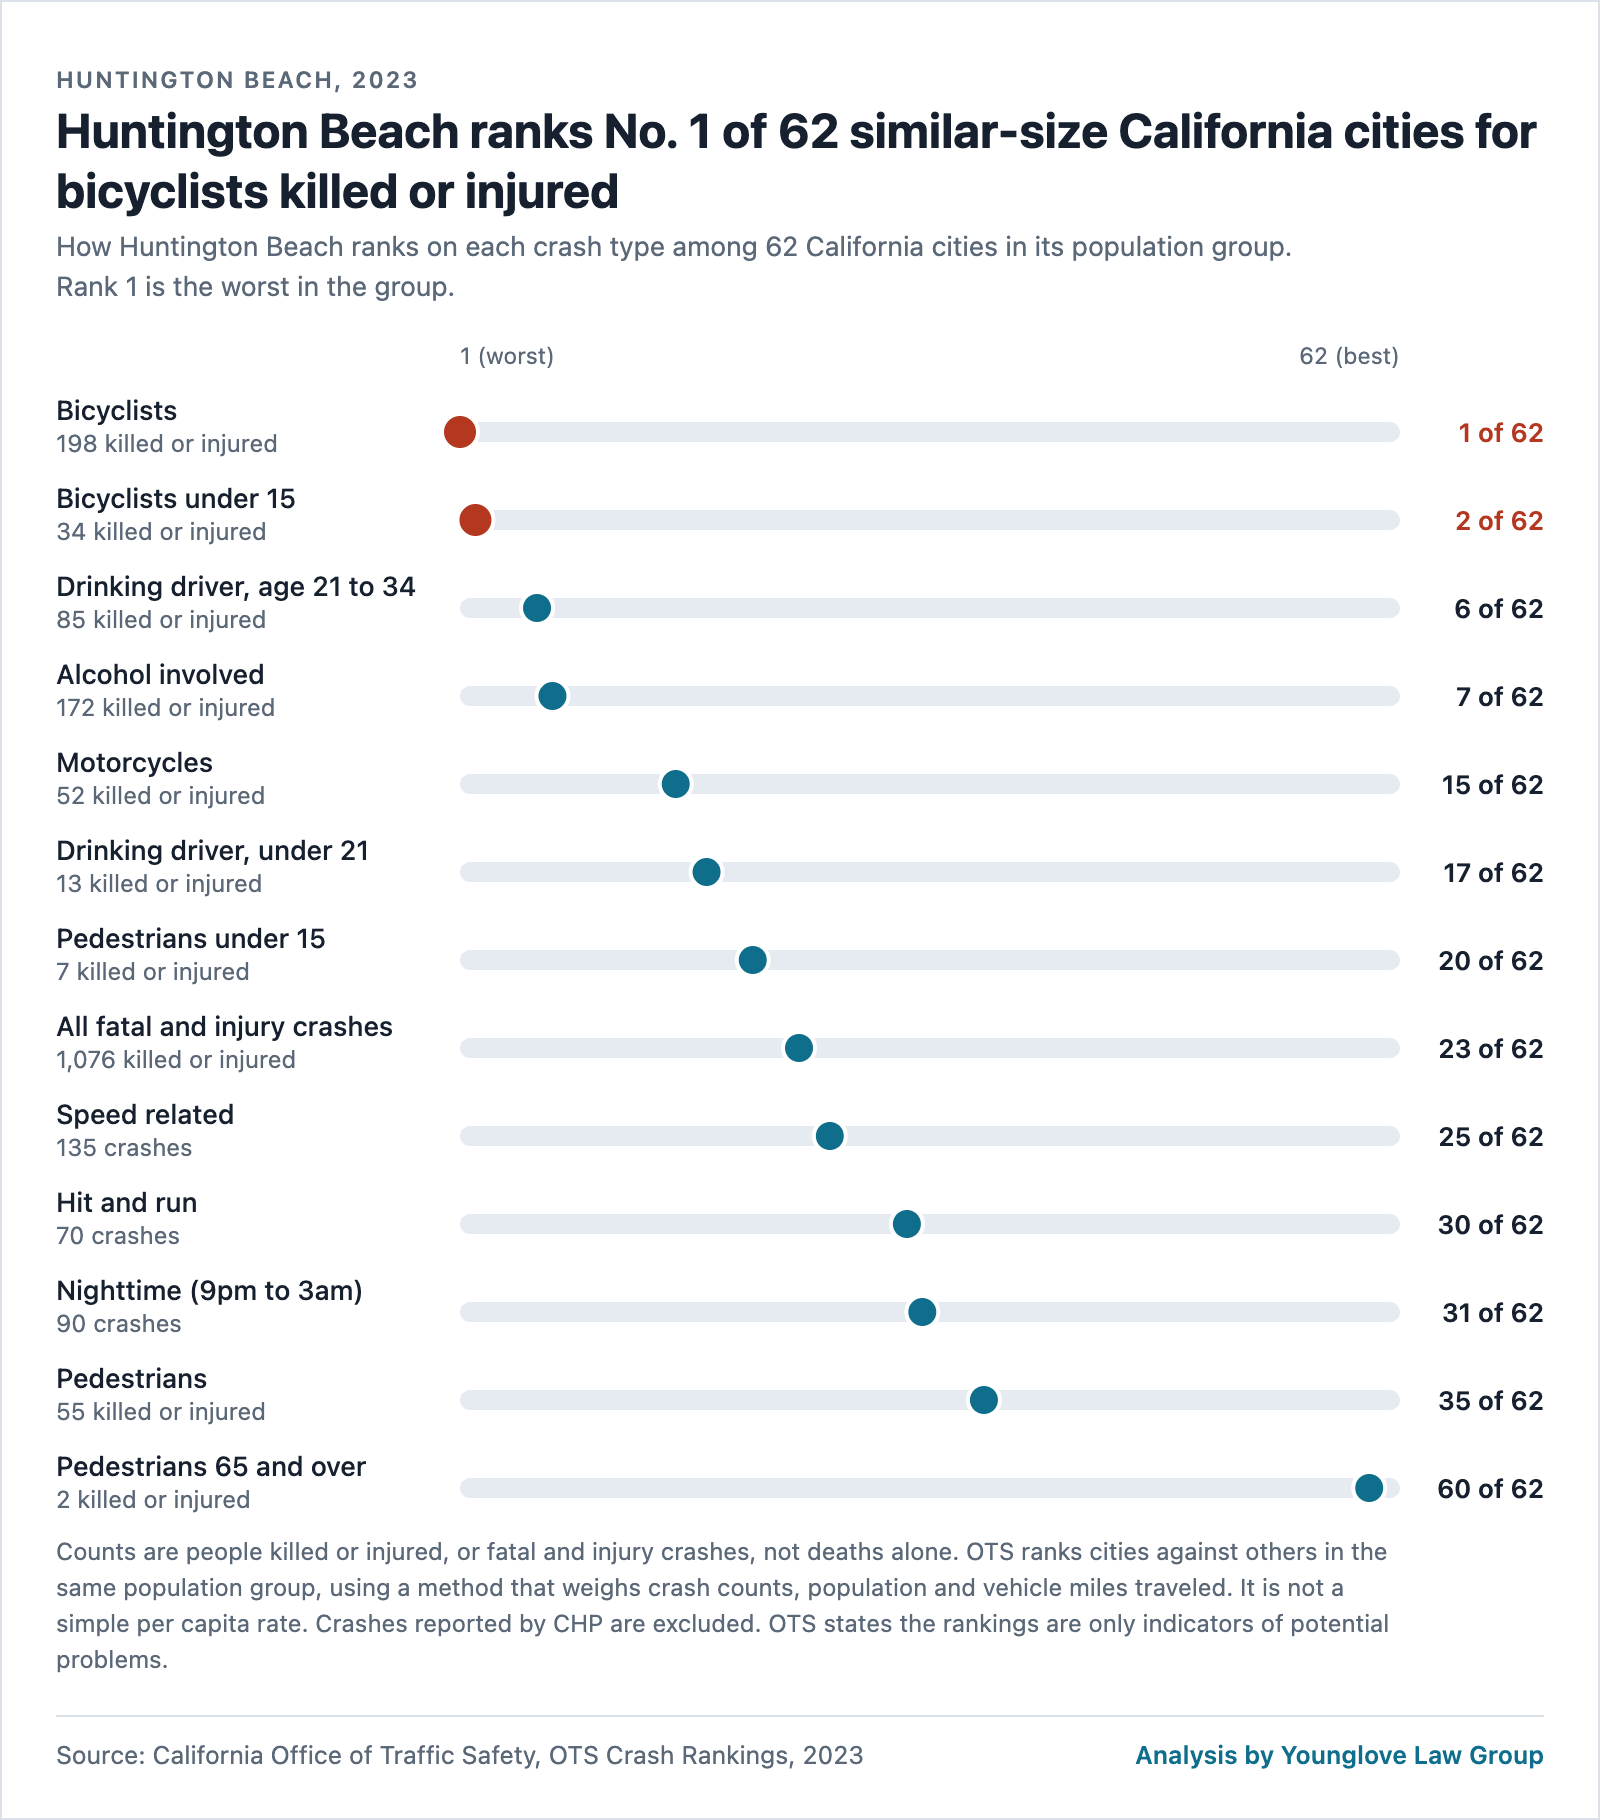
What makes the bicycle figures notable is how they compare with the rest of the city’s record. For all fatal and injury crashes combined, Huntington Beach ranked 23 of 62 similar-size cities in 2023, close to the middle of its group. For pedestrians it ranked 35 of 62. For bicyclists it ranked first, and for bicyclists under 15 it ranked second. No other crash type in the rankings places the city as high.
The pattern is not limited to one year. Huntington Beach held the first or second position for bicyclists in every OTS ranking from 2017 through 2023, and the number of bicyclists killed or injured was higher in 2023 than in any other year in that period.
Key Findings
- Bicyclists: 198 killed or injured in 2023, ranked 1 of 62 cities in the same population group.
- Bicyclists under 15: 34 killed or injured in 2023, ranked 2 of 62.
- Seven-year pattern: Huntington Beach ranked first or second for bicyclists in each year from 2017 through 2023.
- Recent change: the number of bicyclists killed or injured was 101 in 2019 and 198 in 2023, an increase of 96 percent.
- Alcohol: the city ranked 7 of 62 for alcohol-involved crashes and 6 of 62 for crashes involving a drinking driver aged 21 to 34.
Huntington Beach Crash Scorecard, 2023
Each row shows how Huntington Beach ranked among 62 California cities in its population group. A ranking of 1 is the highest in the group, which OTS describes as the worst.
Embed this scorecard on your site
Copy this code. It shows the scorecard image with a credit link to this page.
<a href="https://ylginjury.com/blog/huntington-beach-bicycle-crash-rankings/"><img src="https://ylginjury.com/wp-content/uploads/2026/11/huntington-beach-crash-scorecard-2023.png" alt="Huntington Beach ranks No. 1 of 62 similar-size California cities for bicyclists killed or injured, 2023" width="800"></a>
<p>Source: <a href="https://ylginjury.com/blog/huntington-beach-bicycle-crash-rankings/">Younglove Law Group analysis of California Office of Traffic Safety crash rankings</a></p>| Crash type | Count | Measured as | Rank of 62 |
|---|---|---|---|
| Bicyclists | 198 | Killed or injured | 1 |
| Bicyclists under 15 | 34 | Killed or injured | 2 |
| Drinking driver, age 21 to 34 | 85 | Killed or injured | 6 |
| Alcohol involved | 172 | Killed or injured | 7 |
| Motorcycles | 52 | Killed or injured | 15 |
| Drinking driver, under 21 | 13 | Killed or injured | 17 |
| Pedestrians under 15 | 7 | Killed or injured | 20 |
| All fatal and injury crashes | 1,076 | Killed or injured | 23 |
| Speed related | 135 | Crashes | 25 |
| Hit and run | 70 | Crashes | 30 |
| Nighttime (9pm to 3am) | 90 | Crashes | 31 |
| Pedestrians | 55 | Killed or injured | 35 |
| Pedestrians 65 and over | 2 | Killed or injured | 60 |
Bicyclists Killed or Injured in Huntington Beach, 2017 to 2023
| Year | Bicyclists killed or injured | Rank among similar-size cities |
|---|---|---|
| 2017 | 130 | 2 of 58 |
| 2018 | 132 | 2 of 59 |
| 2019 | 101 | 2 of 59 |
| 2020 | 108 | 1 of 61 |
| 2021 | 146 | 2 of 60 |
| 2022 | 175 | 2 of 61 |
| 2023 | 198 | 1 of 62 |
How to Read These Rankings
- The counts are people killed or injured, or fatal and injury crashes. They are not counts of deaths alone.
- OTS compares each city with other California cities in the same population group. Huntington Beach is in Group B.
- OTS rankings weigh crash counts, population and vehicle miles traveled. They are not a simple per capita rate.
- City rankings cover local streets and state highways inside city limits where jurisdiction is shared. Crashes reported by the California Highway Patrol are not counted against the city.
- The data does not identify the type of bicycle involved, so it does not separate e-bikes from other bicycles.
- OTS states that its rankings are only indicators of potential problems.
Use This Data
Journalists, bloggers and community groups are welcome to cite or republish the scorecard, figures and tables on this page. Please credit Younglove Law Group with a link to this page. The embed code is under the scorecard above.
Methodology
All figures come from the California Office of Traffic Safety OTS Crash Rankings for Huntington Beach for the years 2017 through 2023, retrieved in November 2026. OTS builds its rankings from state crash records, state population estimates and Caltrans travel data. The OTS Composite and DUI arrest rows are not shown here. Source: OTS Crash Rankings, Huntington Beach 2023 and the OTS ranking method.
Questions About a Bicycle Crash in Huntington Beach?
Younglove Law Group is based in Huntington Beach. To learn how the firm approaches bicycle crash cases, or to ask about your own situation, visit our Huntington Beach bicycle accident lawyer page.

